Analysis of Chicago’s Affordable Requirement Ordinance Data
The Affordable Requirements Ordinance, the City of Chicago’s inclusionary housing policy, was first created in 2003 to promote affordable housing as was a major victory for housing activists. It’s 2007 iteration required approved projects covered to set-aside 10% of units for affordable housing (20% if receiving city financial assistance) or pay $100,000 into a fund for affordable housing. For sale housing units needed to be affordable to households below 100% of Area Median Income (AMI) and rental units needed to be affordable to households below 60% of AMI. The 2015 amendment to the ordinance significantly adjusted the framework, separating out developments in low-to-moderate, high-income and downtown zones, setting in-lieu payment fees between $50,000 to $225,000 per unit, and setting more stringent requirements for including at least a portion of the units in the subject development. In 2017, a new Pilot program was created for the rapidly gentrifying areas of Logan Square, Near West Side and Near North Side (and expanded to Pilsen and Little Italy in early 2019) that went further in creating a units integrated into the approved developments covered under the Ordinance. If that doesn’t make it abundantly clear, the policy implemented by the Department of Planning & Development (DPD) is certainly a maze to navigate.
What is surprising is that in spite of all the focus of this as a central part of the city’s desire to break down housing segregation, a clear public understanding of program results and analysis of associated data appears to be few and far between. An Inspector General report from 2017 that focused primarily on the in-lieu fees generated found a deficiency in the fund’s reliance on evidence-based approaches in equitably distributing funds geographically and also that there was $4.5m in unaccounted revenue. These led to corrective actions on the part of the Department of Planning & Development, but yet, there hasn’t been a broader shift to greater public transparency and analysis of program impact that one would have hoped for.
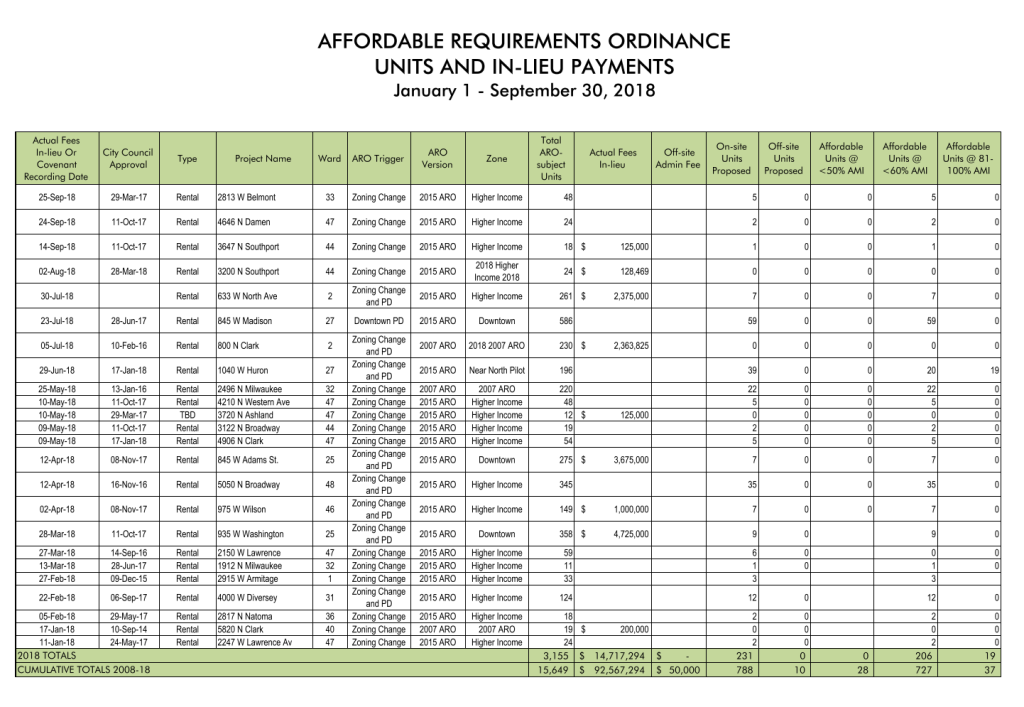
Only recently did I realize that the actual data on the ARO wasn’t located on the Chicago Data Portal, the city’s highly-touted open data hub and bastion of civic transparency, but is included as an table appendix in DPD’s quarterly Affordable Housing Reports (a PDF file). It lists projects that triggered the ARO, affordable units they created (affordability restrictions, on-site and off-site) and how much and when they made in-lieu payment to the designated fund.
Methodology & Data
I decided to make this data more accessible, converting the PDF tables into a dataset for the period between January 1, 2016 and September 30, 2018 that I manipulated using data visualization software (specifically Tableau).
The dataset, itself, can be found here: https://github.com/rancegb/chicago-aro/blob/master/chicago_aro.csv.
The full report, illuminating how the program is performing and producing housing over the time period analyzed with particular attention paid to Chicago’s Aldermanic Wards, can be found here: ARO Performance Report.
Key Observations
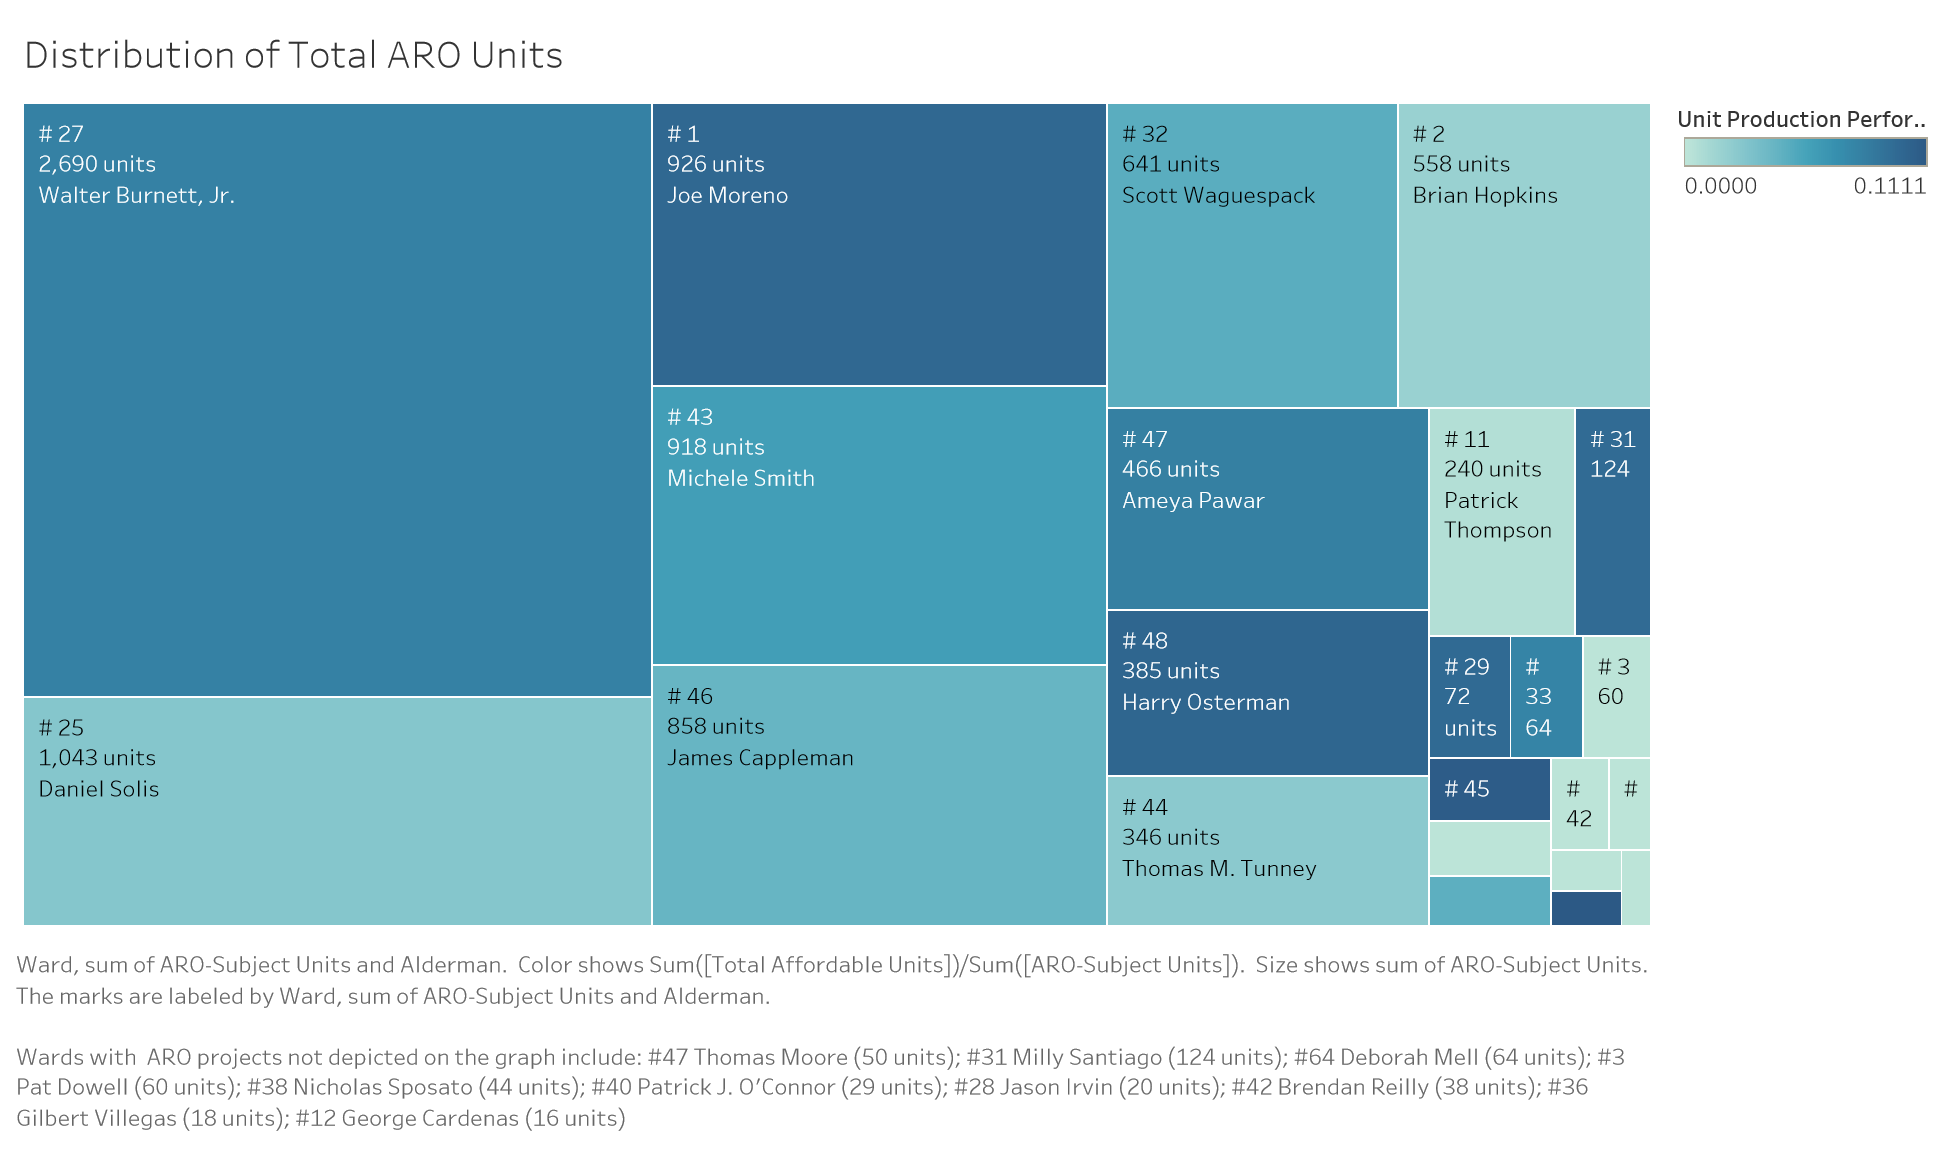 The program shows that projects that trigger the ARO are not geographically spread throughout the city (projects trigger the ARO generally when they get city financial assistance, seek zoning change, use of a planned development designation or purchase city land). While you can find them in 23 Wards (roughly half of the 50 total), 7 of these 23 Wards only have a single project. The 27th Ward (the West Loop represented by Alderman Walter Burnett, Jr.) has had a staggering 2,690 units developed in projects over this nearly 3-year period that has triggered the ARO. Next comes the 25th Ward (Pilsen and South Loop represented by Alderman Daniel Solis) with 1,043 units, the 1st Ward (part of Wicker Park represented by Ald. Joe Moreno) with 926 units and the 43rd Ward (Lincoln Park represented by Ald. Michele Smith). Understanding where the units under covered by the Ordinance are being produced is an important first step to assessing it’s impact.
Taking the perspective that the creation of units (either in development or off-site) is best, you can also see that there are important patterns in where units are being created. Under the Ordinance, Alderman Burnett in the 27th Ward and Alderman Joe Moreno in the 1st Ward have presided over the greatest affordable housing unit creation.
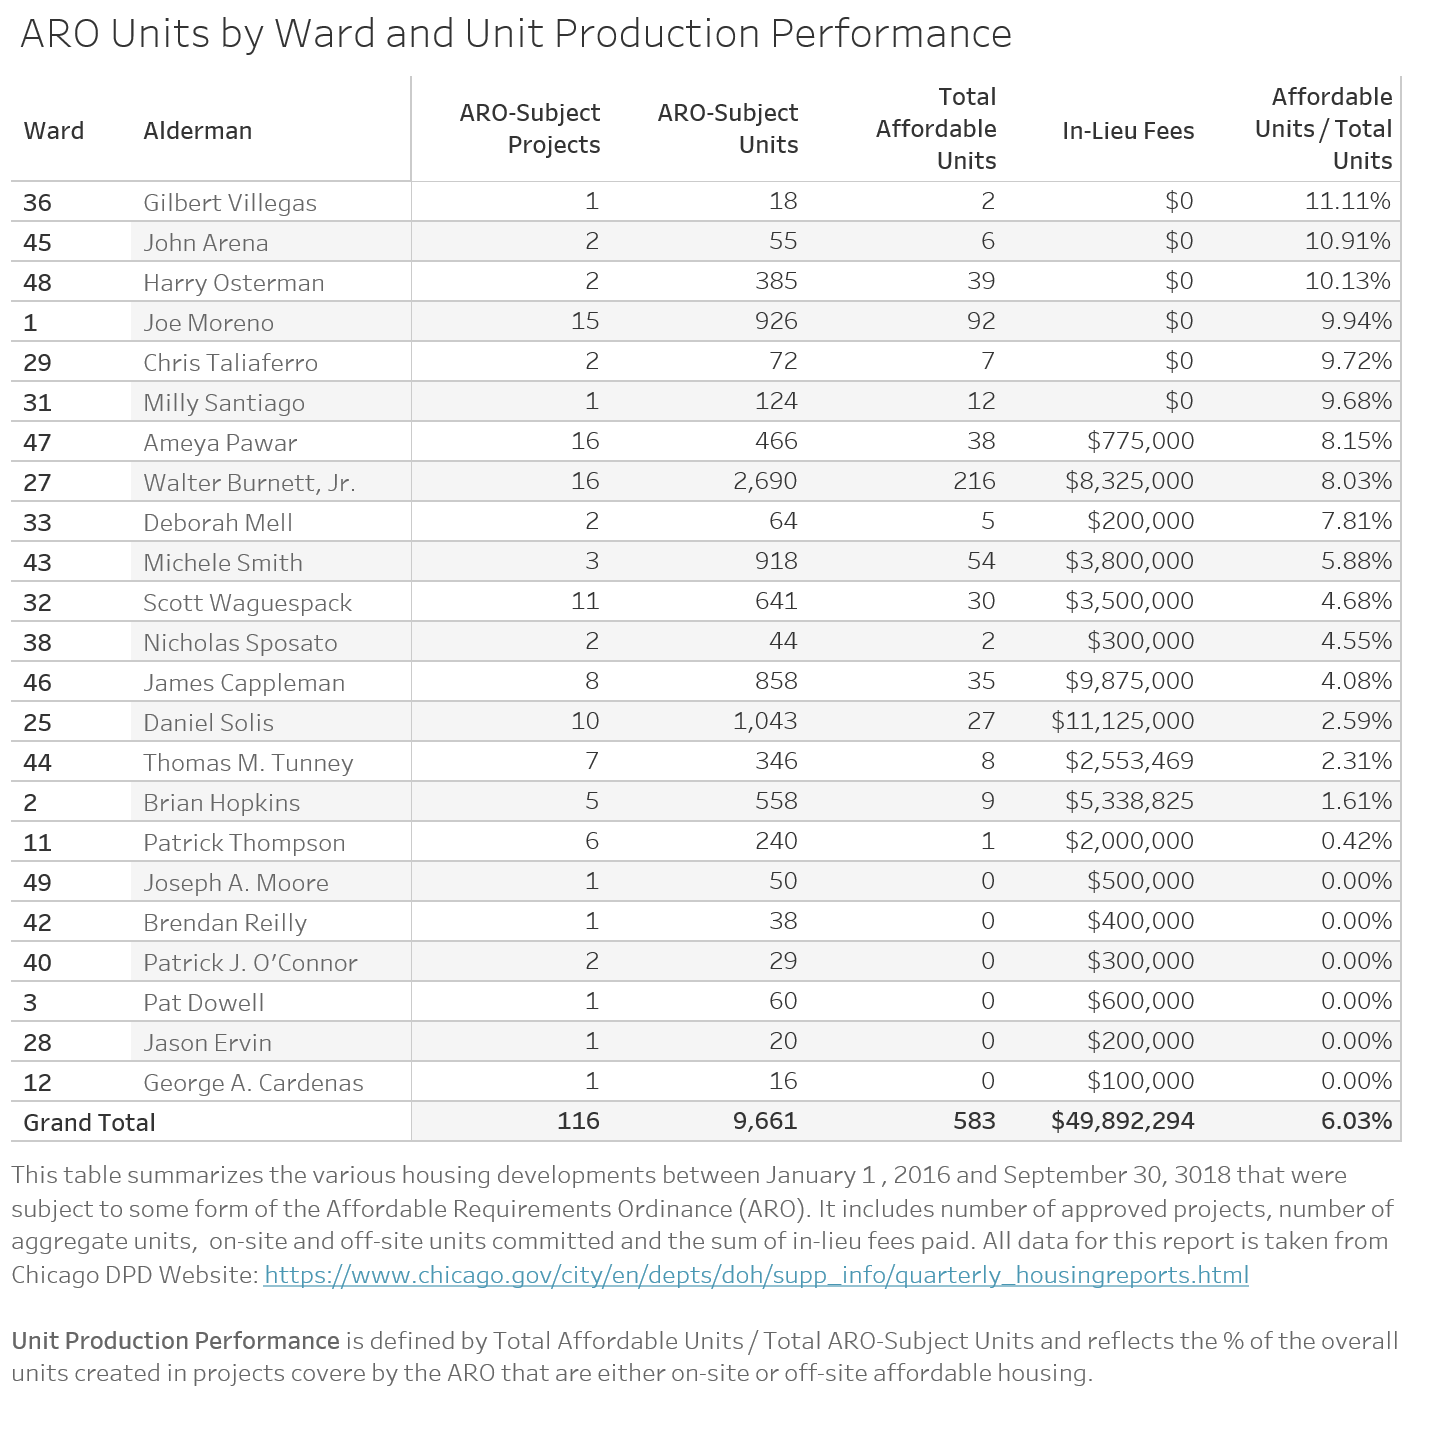
The “Unit Production Performance” calculation that provides an overall percentage of affordable housing units created out of the total ARO-covered projects provides a more standardized view of the different wards. The best advocates (those creating more than 5 units) would be: John Arena of the 45th Ward (6 units), Harry Osterman of the 48th Ward (39 units), Joe Moreno of the 1st Ward (92 units), Chris Taliaferro of the 29th Ward (7 units), and Milly Santiago of the 31st Ward (12 units). All have the highest Unit Production Performance and have not permitted the substitution of in-lieu fees for creating actual units for a combined 23 projects.
Implications
That Alderman Burnett (a major proponent of affordable housing) has been able to wrangle 8% affordable units out of the overall units created and it is a testament to the complicated nature of the discussion around Aldermanic privilege. Surely, his negotiating leverage on behalf of affordable housing would be weakened by some of the calls for simply doing away with the practice. Instead, more nuanced reform proposals (like Lori Lightfoot’s plan to eliminate the veto power at times when less than 10% of a ward’s housing stock is affordable or an alternative approach that does not weaken Aldermanic privilege unless a project delivers less than 20% affordable) seem to be better approaches.
Moreover, while there are other wards where the commitment to affordable housing integration should be held up for above average performance (Ald. Burnett in the 27th Ward along with Alderman Ameya Pawar in the 47th Ward) there are clear examples of wards where Alderman need to do a much better job in pushing inclusionary housing. This includes Wards 11 (Ald. Patrick Thompson), 49 (Ald. Joseph Moore), 42 (Ald. Brendan Reilly), 40 (Ald. Patrick J. O’Connor), 28 (Ald. Jason Ervin), 12 (Ald. George Cardenas) and 3 (Ald. Pat Dowell) where even though there has been 1 or 2 projects, the project was permitted to proceed without a single on-site affordable housing unit. We should also not forget to mention Wards 2 (Ald. Brian Hopkins), 44 (Ald. Thomas Tunney), 25 (Ald. Daniel Solis) and 46 (Ald. James Cappleman) where there have been hundreds of ARO-triggering units approved with significantly less creation of actual units when compared to their colleagues.
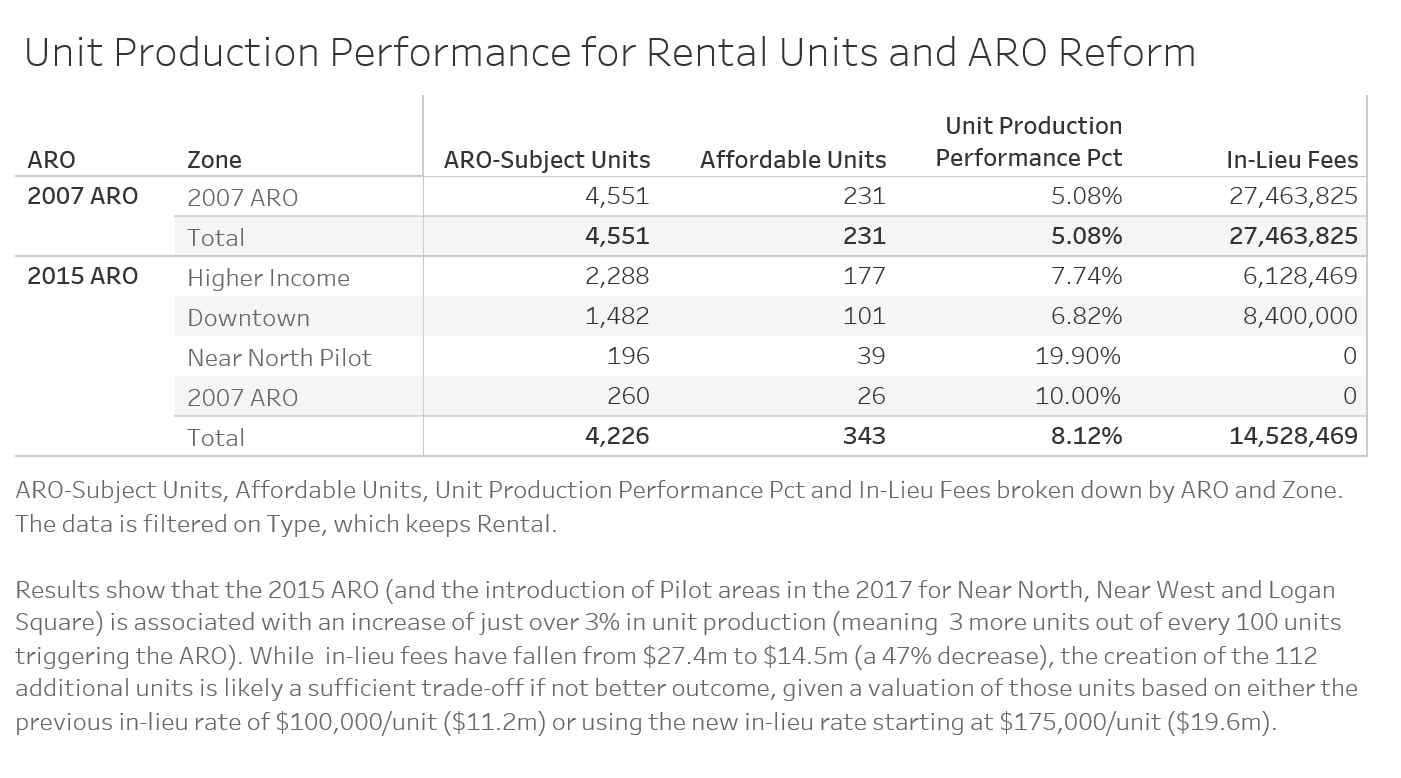
There is a clear demonstration that public policy matters when observing the increased unit production performance under the 2015 ARO and 2017 ARO Pilot that imposed more stringent requirements (increase affordable % required, increased in-lieu payment fees and reduced ability to avoid building on-site).
From a practical standpoint, not only should these data be far more easily accessible on the City’s Data Portal, but the data is surprisingly incomplete. For each approved project, DPD does not actually report the number and type of affordable units required of it, leaving one to guess based on the original 2007 ARO requirement, the 2015 amended version, the 2017 Pilot areas, whether for-sale projects have a different requirement and (more recently) multiple affordability levels of 50% and 60% of AMI which presumably further obscures the applicable rate. Once the requirement for each project is easily understood, DPD also needs to more clearly document the units that are foregone in favor of an in-lieu payment and what that per unit payment is. These relatively basic data points are fundamental for allowing a clear understanding of the policy’s success in creating units or fees that will lead to future units given the increasingly, dizzying array of requirements.
In addition, calls from City Council leaders like Alderman Deb Mell to reform the ARO to better create family-size units (2BR+) certainly justify DPD documenting the bedroom size of the units that are created.
Additional Questions
One question this analysis raises is what types of projects are not being covered by the ARO. The Ordinance is intended to cover any development project that seeks (among other things) a zoning change, so it’s surprising to see relatively few projects in wards covering downtown areas that have seen more than their fair share of residential construction (I’m thinking specifically the 3rd Ward with Ald. Pat Dowell covering a good portion of South Loop and the 42nd Ward with Ald. Brendan Reilly which covers parts of the Loop, River North, parts of West Loop and parts of the Gold Coast. The concern is, quite explicitly, that projects in these areas with the greatest amount of affluence (and closest to the economic activity of the Loop), are proceeding without addressing the city’s affordable housing needs. This also raises a second matter of whether non-residential developments are being let of the hook too easily. There is a notion in inclusionary housing policy that commercial and office developments (by nature of them increasing demand for housing) should also be held responsible for funding affordable housing and it is noted that Boston has for several years implemented this exact policy, recently increasing the affordable housing linkage fee to $9.03 per square foot of construction and $1.78 per square foot of job training.
A second question has to do with incorporating an analysis of the end-use of the fees generated by in-lieu payments. How many units and where are they being created with these funds, and how much funds is required to produce these units? The premise that permitting in-lieu payments is an effective policy rests entirely on a clear sense that the funds go to create units in the similar areas.
A third question has do with the confluence of the ARO and the expanded Density Bonus that allows developers to build a bigger building than would otherwise in exchange for payments into the affordable housing fund. This includes how the policies work together, i.e. whether a density fee overrides or adds to the ARO requirement. Other cities like San Francisco use density bonuses to actually create actual units vs. additional fees, so it deserves a thorough examination as to whether Chicago is approaching this in the best manor.
A fourth question, ultimately, has to do with how we can assess whether the in-lieu fee payment is calibrated appropriately (namely is it high enough) so that it sufficiently motivates a developer to consider building units into it’s development.
Conclusion
Market trends move quickly and public policy will, inevitably, lag behind. That’s one of the chief advantages for moving in the direction of making data public like the projects covered by the Affordable Requirement Ordinances. Through the preparation, visualization and analysis of DPD’s data surrounding the ARO, I hope that I might do my part to advance the discussion around ARO reform.
